What it does
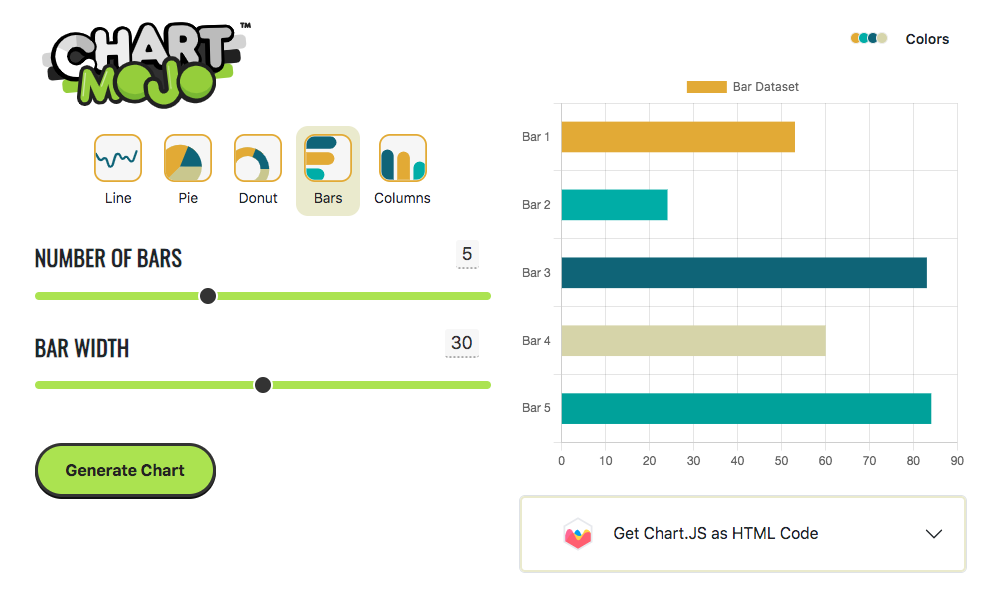
Chart Mojo is a simple web-based chart builder. You pick a chart type, enter your data, and it generates a clean visualization you can use in your designs, presentations, or websites.
No accounts. No complicated settings. Just charts.
Chart types
Chart Mojo supports the chart types you actually use on a regular basis:
- Bar charts (horizontal and vertical)
- Line charts
- Pie charts
- Donut charts
- And more on the way
Also available as a Figma plugin
If you work in Figma, Chart Mojo is also available as a plugin so you can build charts directly inside your design files. No exporting, no copy-pasting. The charts become native Figma layers you can edit, style, and resize like any other frame.
What's next
We're working on more chart types, downloadable Figma components, and a best-practices guide for choosing the right chart for your data. Keep an eye on the blog for updates.
Try Chart Mojo